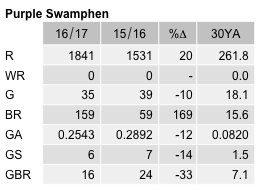
Purple Swamphen
Porphyrio porphyrio
ABR description
The following is extracted from the Annual Bird Report for the twelve months to June 2017.
Very common, breeding resident
This large, distinctive water bird can readily be seen all year at water-bodies across the region.
General: Recent rapid large increases in numbers paused this year, though records increased by 21%. Total birds 13010, 10% down on 2016. Reporting rate, 13.2%, as in 2016, but higher than 10 & 30YAs. Abundance down from 1.24 to 0.92, but well above the 30YA of 0.63. Recorded in all weeks, but fewer birds in spring than usual, but more in autumn. Max 60/2 July JWNR (SmA1), mean 7, median 5, all down on last year. 159 breeding records (mainly di), up from 59. First, di/15 Aug JWNR (LaK1), last dy/15 June, Fadden Hills Pond (BaL1). Grid cells, frequency and reporting rates are all substantially higher than long-term averages, perhaps increased effort to spot and report breeding. Length of the breeding season possibly trending upwards. The average number of months with a breeding record increased from 4 in 1985/2007 to 9 in 2008/2017. Breeding is starting earlier and extending later, e.g. prior to 2010, no breeding records after March: since then, June breeding records in 2010, 2014, 2016 and 2017, and one April record in 2015.
GBS: 151 records of 653 birds from 6 sites in 5 grid cells, all down from the previous year. Abundance, frequency and reporting rates were all down. Sites were in Giralang (McD4 and KaD1), Greenway (HaA2), Jerrabomberra (HaL2) and Crace (LeF1). Reports were spread over 51 weeks with a max 15/1wk April (HaL2), mean 4.3, median 3. Breeding at 2 sites, Jerrabomberra and Greenway, 3wk September to 1wk March, with 16 records, all dy.
Abundance
Abundance is the average number of birds of that species per survey. Where the species was observed (presence recorded) but the number of birds seen was not recorded, this is treated as a count of zero.
Abundance by year
This chart shows the abundance of Purple Swamphen between 1982 and 2017. 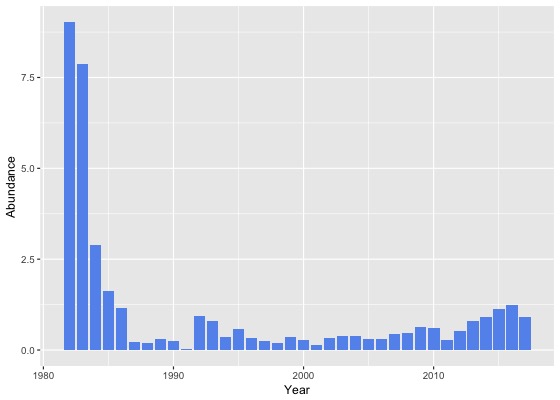
Abundance by month
This chart shows the monthly abundance of Purple Swamphen. The blue lines show the abundance for the twelve months to June 2017 and the bars show the average abundance for the period 1982 to 2017. 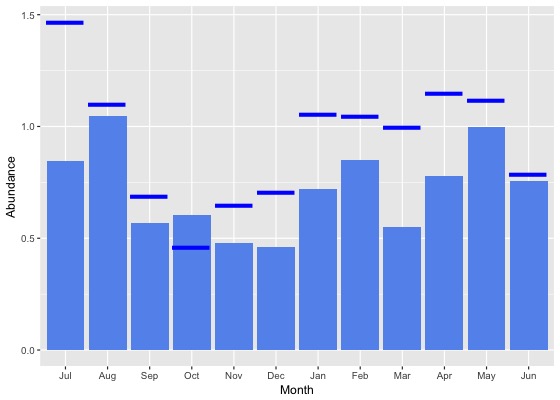
Abundance by season
This chart shows the seasonal abundance of Purple Swamphen. The blue lines show the seasonal abundance for the twelve months to June 2017 and the bars show the average seasonal abundance for the period 1982 to 2017. 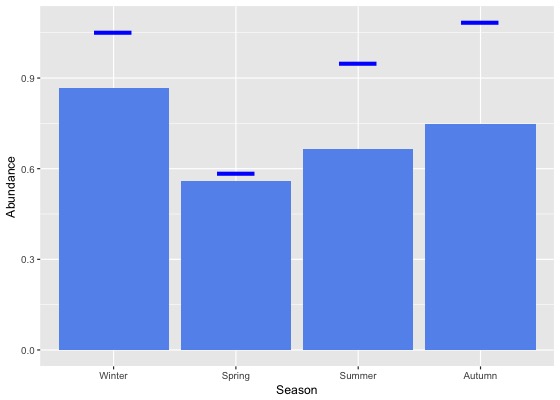
Abundance data
| Month | Season | ||||||||||||||||||
|---|---|---|---|---|---|---|---|---|---|---|---|---|---|---|---|---|---|---|---|
| Period | Jul | Aug | Sep | Oct | Nov | Dec | Jan | Feb | Mar | Apr | May | Jun | Winter | Spring | Summer | Autumn | All | ||
| All years | |||||||||||||||||||
| All | 0.8 | 1.0 | 0.6 | 0.6 | 0.5 | 0.5 | 0.7 | 0.8 | 0.6 | 0.8 | 1.0 | 0.8 | 0.9 | 0.6 | 0.7 | 0.7 | 0.7 | ||
| Previous years | |||||||||||||||||||
| All previous years | 0.7 | 1.0 | 0.6 | 0.6 | 0.4 | 0.4 | 0.7 | 0.8 | 0.5 | 0.7 | 1.0 | 0.7 | 0.8 | 0.6 | 0.6 | 0.7 | 0.7 | ||
| Previous 30 years | 0.8 | 0.9 | 0.5 | 0.6 | 0.4 | 0.4 | 0.7 | 0.7 | 0.5 | 0.7 | 1.0 | 0.7 | 0.8 | 0.5 | 0.6 | 0.7 | 0.6 | ||
| Previous 20 years | 0.9 | 1.1 | 0.6 | 0.6 | 0.5 | 0.4 | 0.7 | 0.8 | 0.5 | 0.7 | 1.1 | 0.7 | 0.9 | 0.6 | 0.6 | 0.7 | 0.7 | ||
| 10 year groups | |||||||||||||||||||
| [2007,2017) | 1.2 | 1.3 | 0.8 | 0.7 | 0.7 | 0.5 | 0.8 | 1.0 | 0.7 | 0.9 | 1.4 | 0.9 | 1.1 | 0.7 | 0.7 | 0.9 | 0.9 | ||
| [1997,2007) | 0.4 | 0.4 | 0.2 | 0.3 | 0.2 | 0.2 | 0.5 | 0.4 | 0.3 | 0.2 | 0.4 | 0.2 | 0.3 | 0.2 | 0.3 | 0.3 | 0.3 | ||
| [1987,1997) | 0.3 | 0.5 | 0.2 | 0.3 | 0.2 | 0.3 | 0.3 | 0.4 | 0.2 | 0.6 | 0.2 | 0.4 | 0.4 | 0.2 | 0.3 | 0.3 | 0.3 | ||
| 5 year groups | |||||||||||||||||||
| [2012,2017) | 1.4 | 1.5 | 1.0 | 0.8 | 0.7 | 0.6 | 0.9 | 1.1 | 0.8 | 1.1 | 1.7 | 1.2 | 1.4 | 0.8 | 0.9 | 1.1 | 1.0 | ||
| [2007,2012) | 0.5 | 0.9 | 0.5 | 0.6 | 0.5 | 0.2 | 0.4 | 0.6 | 0.3 | 0.3 | 0.7 | 0.4 | 0.5 | 0.5 | 0.4 | 0.4 | 0.5 | ||
| [2002,2007) | 0.4 | 0.4 | 0.3 | 0.4 | 0.3 | 0.3 | 0.7 | 0.4 | 0.2 | 0.3 | 0.5 | 0.2 | 0.3 | 0.3 | 0.4 | 0.3 | 0.3 | ||
| [1997,2002) | 0.3 | 0.4 | 0.1 | 0.2 | 0.1 | 0.1 | 0.3 | 0.4 | 0.3 | 0.2 | 0.3 | 0.3 | 0.4 | 0.1 | 0.2 | 0.3 | 0.2 | ||
| [1992,1997) | 1.0 | 1.0 | 0.5 | 0.6 | 0.5 | 0.3 | 0.7 | 0.5 | 0.3 | 0.6 | 0.6 | 0.2 | 0.7 | 0.5 | 0.5 | 0.5 | 0.6 | ||
| [1987,1992) | 0.0 | 0.3 | 0.1 | 0.2 | 0.0 | 0.3 | 0.1 | 0.4 | 0.1 | 0.6 | 0.1 | 0.6 | 0.3 | 0.1 | 0.2 | 0.3 | 0.2 | ||
| Year | |||||||||||||||||||
| 2017 | 1.5 | 1.1 | 0.7 | 0.5 | 0.6 | 0.7 | 1.1 | 1.0 | 1.0 | 1.1 | 1.1 | 0.8 | 1.1 | 0.6 | 0.9 | 1.1 | 0.9 | ||
| 2016 | 1.5 | 1.8 | 1.2 | 1.1 | 1.0 | 0.8 | 1.1 | 1.2 | 0.8 | 1.3 | 2.0 | 1.4 | 1.6 | 1.1 | 1.1 | 1.3 | 1.2 | ||
| 2015 | 1.5 | 1.6 | 1.1 | 0.9 | 0.6 | 0.8 | 0.9 | 1.1 | 1.2 | 1.4 | 1.9 | 1.3 | 1.4 | 0.9 | 0.9 | 1.5 | 1.1 | ||
| 2014 | 2.1 | 1.2 | 1.0 | 0.6 | 0.8 | 0.5 | 0.9 | 0.7 | 0.7 | 0.8 | 1.4 | 1.4 | 1.5 | 0.8 | 0.8 | 0.9 | 0.9 | ||
| 2013 | 1.2 | 1.1 | 0.4 | 0.6 | 0.7 | 0.5 | 0.8 | 1.2 | 0.7 | 0.9 | 1.2 | 1.4 | 1.3 | 0.6 | 0.8 | 0.9 | 0.8 | ||
| 2012 | 0.7 | 0.9 | 0.5 | 0.6 | 0.3 | 0.3 | 0.6 | 0.4 | 0.2 | 0.4 | 0.8 | 0.6 | 0.7 | 0.5 | 0.5 | 0.4 | 0.5 | ||
| 2011 | 0.4 | 0.5 | 0.3 | 0.4 | 0.1 | 0.1 | 0.2 | 0.2 | 0.1 | 0.2 | 0.2 | 0.6 | 0.6 | 0.3 | 0.1 | 0.2 | 0.3 | ||
| 2010 | 0.9 | 1.1 | 0.8 | 0.9 | 0.4 | 0.3 | 0.4 | 1.0 | 0.4 | 0.3 | 1.1 | 0.3 | 0.6 | 0.8 | 0.4 | 0.5 | 0.6 | ||
| 2009 | 0.5 | 2.6 | 0.7 | 0.5 | 0.8 | 0.4 | 0.6 | 0.8 | 0.3 | 0.4 | 0.8 | 0.6 | 1.0 | 0.6 | 0.6 | 0.5 | 0.6 | ||
| 2008 | 0.1 | 0.4 | 0.5 | 0.6 | 0.3 | 0.2 | 0.7 | 1.1 | 0.3 | 0.3 | 1.0 | 0.2 | 0.2 | 0.5 | 0.5 | 0.4 | 0.5 | ||
| 2007 | 0.6 | 0.2 | 0.0 | 0.6 | 0.7 | 0.2 | 0.6 | 0.3 | 0.2 | 0.6 | 0.9 | 0.2 | 0.3 | 0.5 | 0.4 | 0.5 | 0.4 | ||
| 2006 | 0.4 | 0.1 | 0.3 | 0.5 | 0.1 | 0.1 | 0.5 | 0.5 | 0.2 | 0.1 | 0.2 | 0.2 | 0.3 | 0.4 | 0.4 | 0.2 | 0.3 | ||
| 2005 | 0.2 | 0.6 | 0.3 | 0.2 | 0.4 | 0.3 | 0.8 | 0.1 | 0.2 | 0.1 | 0.6 | 0.0 | 0.2 | 0.3 | 0.4 | 0.3 | 0.3 | ||
| 2004 | 0.5 | 0.5 | 0.3 | 0.6 | 0.3 | 0.2 | 0.5 | 0.9 | 0.3 | 0.1 | 0.5 | 0.3 | 0.4 | 0.4 | 0.5 | 0.3 | 0.4 | ||
| 2003 | 0.9 | 0.6 | 0.3 | 0.2 | 0.4 | 0.3 | 0.5 | 0.3 | 0.2 | 0.5 | 0.7 | 0.1 | 0.5 | 0.3 | 0.3 | 0.4 | 0.4 | ||
| 2002 | 0.1 | 0.3 | 0.2 | 0.2 | 0.1 | 0.5 | 1.0 | 0.2 | 0.2 | 0.4 | 0.7 | 0.3 | 0.2 | 0.2 | 0.5 | 0.4 | 0.3 | ||
| 2001 | 0.2 | 0.2 | 0.1 | 0.1 | 0.0 | 0.0 | 0.4 | 0.2 | 0.2 | 0.1 | 0.2 | 0.1 | 0.2 | 0.1 | 0.2 | 0.2 | 0.1 | ||
| 2000 | 0.6 | 0.9 | 0.3 | 0.2 | 0.2 | 0.1 | 0.2 | 0.5 | 0.3 | 0.2 | 0.1 | 0.1 | 0.5 | 0.2 | 0.2 | 0.2 | 0.3 | ||
| 1999 | 0.2 | 0.3 | 0.2 | 0.1 | 0.2 | 0.2 | 0.3 | 0.3 | 0.6 | 0.0 | 0.6 | 0.8 | 0.6 | 0.2 | 0.3 | 0.4 | 0.3 | ||
| 1998 | 0.0 | 0.2 | 0.1 | 0.2 | 0.0 | 0.2 | 0.4 | 0.3 | 0.2 | 0.2 | 0.5 | 0.3 | 0.2 | 0.1 | 0.3 | 0.2 | 0.2 | ||
| 1997 | 0.3 | 0.0 | 0.1 | 0.3 | 0.1 | 0.3 | 0.2 | 0.6 | 0.7 | 0.2 | 0.2 | 0.3 | 0.2 | 0.1 | 0.4 | 0.3 | 0.2 | ||
| 1996 | 0.9 | 0.1 | 0.2 | 0.2 | 0.2 | 0.2 | 0.4 | 0.5 | 0.1 | 0.7 | 0.8 | 0.2 | 0.3 | 0.2 | 0.3 | 0.4 | 0.3 | ||
| 1995 | 1.3 | 0.7 | 0.2 | 1.0 | 0.2 | 0.4 | 0.8 | 0.4 | 0.4 | 0.9 | 0.1 | 0.1 | 0.7 | 0.6 | 0.6 | 0.5 | 0.6 | ||
| 1994 | 0.3 | 0.7 | 0.0 | 0.5 | 0.2 | 0.2 | 0.6 | 0.4 | 0.2 | 0.3 | 0.8 | 0.2 | 0.4 | 0.2 | 0.4 | 0.4 | 0.4 | ||
| 1993 | 0.5 | 2.8 | 0.7 | 0.7 | 1.6 | 0.0 | 0.3 | 1.1 | 0.5 | 0.8 | 0.1 | 0.2 | 1.3 | 1.0 | 0.4 | 0.5 | 0.8 | ||
| 1992 | 1.7 | 1.0 | 1.5 | 0.6 | 0.9 | 0.8 | 1.7 | 0.6 | 0.3 | 0.6 | 1.1 | 0.5 | 1.1 | 1.0 | 1.1 | 0.7 | 0.9 | ||
| 1991 | 0.0 | 0.0 | 0.0 | 0.0 | 0.0 | 0.0 | 0.0 | 0.1 | 0.0 | 0.2 | 0.0 | 0.2 | 0.0 | 0.0 | 0.0 | 0.1 | 0.0 | ||
| 1990 | 0.0 | 0.0 | 0.0 | 0.1 | 0.0 | 0.1 | 0.7 | 0.2 | 0.4 | 1.1 | 0.5 | 0.6 | 0.1 | 0.1 | 0.3 | 0.6 | 0.3 | ||
| 1989 | 0.1 | 0.4 | 0.1 | 0.3 | 0.1 | 0.3 | 0.0 | 0.5 | 0.0 | 0.9 | 0.0 | 0.8 | 0.4 | 0.1 | 0.3 | 0.4 | 0.3 | ||
| 1988 | 0.1 | 0.3 | 0.1 | 0.2 | 0.0 | 0.3 | 0.1 | 0.4 | 0.1 | 0.6 | 0.1 | 0.3 | 0.2 | 0.1 | 0.2 | 0.2 | 0.2 | ||
| 1987 | 0.0 | 2.7 | 0.1 | 0.2 | 0.1 | 0.2 | 0.1 | 0.3 | 0.1 | 0.2 | 0.0 | 0.7 | 0.8 | 0.1 | 0.2 | 0.1 | 0.2 | ||
| 1986 | 0.0 | 2.9 | 0.0 | 1.7 | 0.0 | 0.9 | 0.0 | 3.0 | 0.0 | 1.4 | 0.0 | 3.7 | 2.4 | 0.4 | 1.5 | 0.6 | 1.2 | ||
| 1985 | 0.3 | 4.4 | 1.2 | 1.3 | 0.9 | 1.1 | 0.4 | 4.5 | 0.2 | 3.6 | 0.0 | 3.0 | 2.6 | 1.2 | 1.7 | 1.8 | 1.6 | ||
| 1984 | 0.0 | 15.8 | 0.0 | 4.8 | 0.0 | 3.9 | 0.1 | 4.6 | 0.0 | 3.6 | 0.1 | 4.1 | 6.1 | 2.7 | 2.7 | 1.4 | 2.9 | ||
| 1983 | 0.0 | 11.6 | 6.8 | 11.2 | 7.7 | 6.2 | 0.0 | 6.7 | 0.0 | - | 10.1 | 11.3 | 9.1 | 9.2 | 5.2 | 8.6 | 7.9 | ||
| 1982 | - | 11.2 | - | 0.0 | 9.9 | 7.1 | - | 5.3 | - | 10.3 | - | 11.1 | 11.1 | 8.8 | 6.3 | 10.3 | 9.0 | ||
Reporting rates
Reporting rate is the proportion of all surveys in which the species was present.
Reporting rate by year
This chart shows the reporting rate of Purple Swamphen each year between 1982 and 2017. 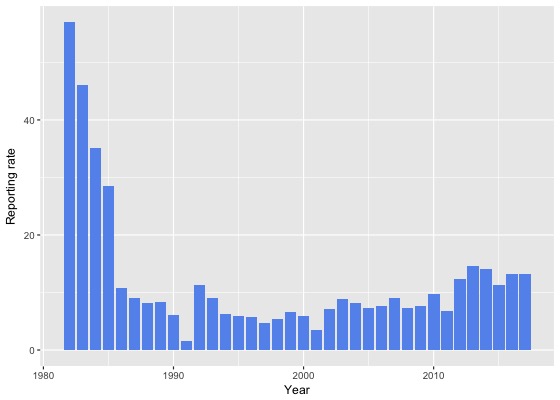
Reporting rate by month
This chart shows the reporting rate by month of Purple Swamphen. The blue lines show the reporting rate for the twelve months to June 2017 and the bars show the average reporting rate for the period 1982 to 2017. 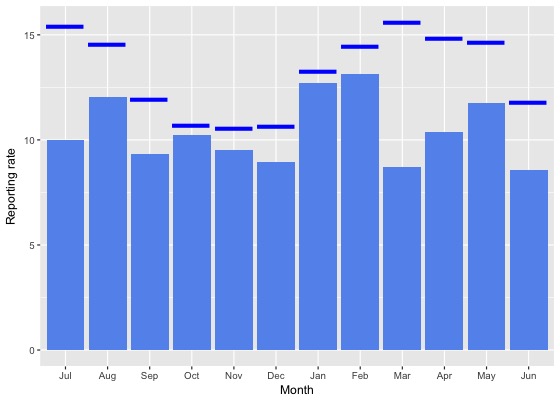
Reporting rate by season
This chart shows the seasonal reporting rate of Purple Swamphen. The blue lines show the seasonal reporting rate for the twelve months to June 2017 and the bars show the average seasonal reporting rate for the period 1982 to 2017. 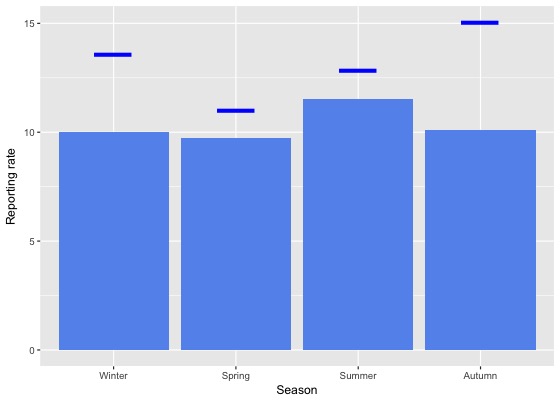
Reporting rate data
| Month | Season | ||||||||||||||||||
|---|---|---|---|---|---|---|---|---|---|---|---|---|---|---|---|---|---|---|---|
| Period | Jul | Aug | Sep | Oct | Nov | Dec | Jan | Feb | Mar | Apr | May | Jun | Winter | Spring | Summer | Autumn | All | ||
| All years | |||||||||||||||||||
| All | 10.0 | 12.0 | 9.3 | 10.2 | 9.5 | 8.9 | 12.7 | 13.1 | 8.7 | 10.4 | 11.8 | 8.6 | 10.0 | 9.8 | 11.5 | 10.1 | 10.4 | ||
| Previous years | |||||||||||||||||||
| All previous years | 9.1 | 11.5 | 8.9 | 10.2 | 9.4 | 8.7 | 12.6 | 12.9 | 7.5 | 9.7 | 11.1 | 8.0 | 9.4 | 9.6 | 11.3 | 9.2 | 9.9 | ||
| Previous 30 years | 9.2 | 10.8 | 8.8 | 9.9 | 9.2 | 8.3 | 12.7 | 12.2 | 7.5 | 9.2 | 11.1 | 7.5 | 9.0 | 9.4 | 11.0 | 9.0 | 9.6 | ||
| Previous 20 years | 10.0 | 12.0 | 9.1 | 10.0 | 10.3 | 8.2 | 13.6 | 12.8 | 7.9 | 9.3 | 12.5 | 7.2 | 9.4 | 9.8 | 11.4 | 9.5 | 10.1 | ||
| 10 year groups | |||||||||||||||||||
| [2007,2017) | 12.2 | 13.7 | 11.1 | 10.5 | 12.7 | 9.8 | 14.4 | 14.2 | 9.1 | 10.6 | 14.0 | 8.8 | 11.1 | 11.2 | 12.8 | 10.9 | 11.5 | ||
| [1997,2007) | 6.3 | 8.2 | 5.2 | 8.3 | 5.5 | 5.3 | 10.9 | 9.1 | 5.2 | 5.7 | 8.9 | 3.8 | 5.8 | 6.4 | 7.9 | 6.3 | 6.6 | ||
| [1987,1997) | 6.3 | 7.3 | 7.1 | 9.4 | 5.2 | 8.5 | 7.3 | 9.4 | 5.4 | 9.2 | 5.7 | 8.7 | 7.5 | 7.2 | 8.4 | 6.8 | 7.4 | ||
| 5 year groups | |||||||||||||||||||
| [2012,2017) | 14.0 | 14.6 | 12.4 | 11.4 | 13.8 | 11.8 | 14.8 | 14.8 | 10.4 | 12.8 | 15.0 | 11.3 | 13.1 | 12.3 | 13.9 | 12.4 | 12.9 | ||
| [2007,2012) | 7.1 | 10.6 | 8.2 | 9.1 | 9.7 | 5.4 | 12.9 | 11.6 | 5.7 | 5.5 | 11.1 | 4.2 | 6.3 | 9.0 | 9.4 | 6.8 | 8.0 | ||
| [2002,2007) | 6.7 | 9.5 | 6.4 | 9.7 | 7.2 | 6.6 | 14.4 | 10.6 | 6.0 | 6.7 | 10.5 | 3.3 | 6.0 | 7.8 | 9.9 | 7.3 | 7.8 | ||
| [1997,2002) | 5.7 | 6.6 | 3.8 | 6.2 | 3.6 | 3.5 | 7.0 | 7.5 | 4.1 | 4.4 | 7.0 | 4.5 | 5.5 | 4.5 | 5.7 | 4.9 | 5.1 | ||
| [1992,1997) | 8.9 | 6.9 | 5.6 | 10.1 | 5.9 | 5.6 | 9.7 | 9.0 | 5.2 | 7.5 | 8.2 | 5.3 | 6.9 | 7.4 | 8.1 | 6.9 | 7.3 | ||
| [1987,1992) | 5.1 | 7.6 | 7.8 | 8.9 | 4.9 | 9.8 | 5.9 | 9.6 | 5.5 | 10.2 | 4.5 | 10.6 | 7.7 | 7.1 | 8.5 | 6.8 | 7.5 | ||
| Year | |||||||||||||||||||
| 2017 | 15.4 | 14.5 | 11.9 | 10.7 | 10.6 | 10.7 | 13.2 | 14.5 | 15.6 | 14.8 | 14.6 | 11.8 | 13.6 | 11.0 | 12.9 | 15.0 | 13.2 | ||
| 2016 | 11.6 | 13.8 | 11.8 | 11.3 | 14.6 | 10.5 | 11.7 | 15.9 | 11.1 | 15.4 | 17.9 | 12.8 | 12.8 | 12.3 | 12.9 | 14.5 | 13.2 | ||
| 2015 | 15.4 | 15.0 | 14.8 | 12.4 | 10.4 | 11.6 | 10.7 | 10.8 | 9.0 | 9.8 | 11.0 | 7.8 | 11.8 | 12.6 | 11.0 | 9.8 | 11.3 | ||
| 2014 | 20.0 | 13.9 | 10.6 | 11.0 | 11.9 | 12.0 | 20.0 | 15.2 | 11.3 | 11.5 | 14.3 | 17.8 | 17.0 | 11.1 | 17.0 | 12.1 | 14.1 | ||
| 2013 | 17.3 | 20.8 | 15.4 | 11.0 | 20.3 | 13.1 | 19.4 | 16.4 | 11.1 | 12.6 | 13.4 | 10.1 | 15.6 | 14.8 | 16.1 | 12.1 | 14.7 | ||
| 2012 | 11.1 | 11.4 | 8.3 | 10.9 | 12.8 | 13.2 | 17.4 | 19.5 | 8.6 | 12.4 | 17.1 | 9.3 | 10.5 | 10.7 | 16.4 | 12.0 | 12.4 | ||
| 2011 | 11.4 | 9.6 | 5.8 | 7.5 | 4.8 | 6.0 | 11.2 | 11.9 | 3.8 | 3.8 | 5.8 | 4.7 | 7.1 | 6.5 | 9.4 | 4.4 | 6.8 | ||
| 2010 | 7.3 | 10.5 | 13.9 | 11.8 | 8.6 | 9.1 | 15.5 | 14.1 | 3.9 | 5.5 | 15.7 | 5.0 | 6.8 | 11.7 | 12.2 | 6.6 | 9.7 | ||
| 2009 | 5.0 | 20.8 | 7.9 | 6.3 | 10.7 | 2.6 | 12.0 | 10.0 | 7.0 | 5.3 | 12.2 | 4.5 | 8.1 | 7.6 | 7.6 | 7.5 | 7.7 | ||
| 2008 | 4.1 | 8.7 | 8.6 | 9.3 | 6.7 | 3.6 | 11.9 | 13.0 | 5.9 | 5.3 | 12.6 | 2.3 | 4.4 | 8.7 | 8.1 | 6.8 | 7.3 | ||
| 2007 | 8.8 | 4.6 | 4.1 | 11.3 | 18.2 | 4.4 | 14.2 | 9.6 | 8.9 | 8.5 | 16.3 | 4.2 | 5.1 | 10.5 | 9.0 | 10.3 | 9.0 | ||
| 2006 | 5.9 | 5.8 | 4.0 | 9.0 | 4.8 | 3.4 | 16.9 | 18.5 | 7.0 | 6.5 | 10.9 | 3.1 | 4.5 | 6.6 | 12.4 | 7.7 | 7.6 | ||
| 2005 | 5.1 | 12.1 | 6.7 | 7.7 | 9.7 | 4.0 | 12.1 | 8.7 | 7.8 | 4.4 | 14.4 | 1.9 | 5.0 | 7.7 | 7.2 | 8.9 | 7.3 | ||
| 2004 | 9.1 | 13.2 | 7.7 | 11.6 | 8.1 | 6.5 | 9.7 | 11.1 | 6.2 | 4.9 | 6.8 | 4.3 | 8.8 | 9.1 | 8.5 | 5.9 | 8.1 | ||
| 2003 | 12.0 | 7.9 | 9.7 | 13.0 | 10.6 | 8.5 | 10.4 | 8.8 | 4.9 | 8.8 | 9.3 | 3.7 | 7.4 | 11.0 | 9.0 | 7.4 | 8.9 | ||
| 2002 | 1.7 | 7.6 | 3.5 | 8.6 | 3.0 | 9.1 | 22.0 | 6.6 | 3.6 | 8.9 | 7.1 | 4.3 | 4.2 | 5.2 | 11.7 | 6.1 | 7.1 | ||
| 2001 | 4.9 | 3.6 | 2.4 | 3.8 | 4.5 | 1.1 | 7.0 | 5.2 | 2.1 | 3.9 | 3.5 | 2.0 | 3.5 | 3.3 | 4.0 | 3.0 | 3.4 | ||
| 2000 | 7.9 | 10.5 | 5.6 | 7.9 | 5.1 | 4.3 | 5.8 | 8.6 | 4.9 | 4.9 | 6.4 | 2.2 | 6.5 | 6.2 | 6.0 | 5.2 | 5.9 | ||
| 1999 | 8.8 | 8.2 | 4.6 | 6.9 | 3.2 | 5.0 | 8.0 | 6.4 | 7.6 | 4.1 | 9.1 | 8.9 | 8.7 | 4.9 | 6.4 | 6.8 | 6.6 | ||
| 1998 | 5.4 | 5.7 | 4.1 | 5.4 | 0.0 | 3.8 | 10.3 | 9.4 | 1.1 | 10.3 | 18.5 | 8.0 | 6.7 | 3.0 | 7.0 | 6.3 | 5.3 | ||
| 1997 | 3.4 | 3.4 | 2.7 | 7.9 | 3.4 | 4.8 | 5.9 | 12.3 | 7.5 | 2.8 | 6.7 | 1.4 | 2.8 | 4.3 | 7.1 | 4.6 | 4.6 | ||
| 1996 | 6.0 | 4.3 | 4.0 | 5.3 | 2.8 | 6.1 | 9.7 | 7.1 | 2.0 | 6.2 | 13.8 | 4.6 | 4.8 | 4.0 | 7.7 | 6.2 | 5.7 | ||
| 1995 | 9.7 | 7.8 | 3.9 | 9.1 | 2.7 | 4.6 | 5.3 | 6.3 | 5.1 | 6.5 | 2.6 | 4.3 | 7.3 | 5.8 | 5.3 | 5.0 | 5.9 | ||
| 1994 | 9.8 | 7.8 | 0.0 | 11.6 | 1.5 | 2.2 | 7.4 | 12.1 | 5.7 | 5.3 | 11.2 | 5.6 | 7.4 | 4.1 | 7.6 | 7.0 | 6.3 | ||
| 1993 | 8.2 | 7.7 | 4.8 | 17.3 | 19.7 | 0.0 | 8.2 | 12.5 | 6.2 | 15.0 | 3.9 | 4.3 | 6.6 | 14.3 | 6.3 | 7.8 | 9.0 | ||
| 1992 | 10.8 | 7.4 | 14.1 | 10.6 | 11.1 | 12.7 | 22.4 | 9.8 | 8.5 | 8.5 | 10.5 | 8.3 | 8.9 | 12.0 | 15.4 | 9.2 | 11.3 | ||
| 1991 | 0.8 | 2.1 | 0.0 | 0.0 | 1.0 | 1.4 | 1.8 | 6.0 | 0.0 | 5.1 | 0.0 | 6.0 | 2.2 | 0.3 | 2.8 | 1.6 | 1.6 | ||
| 1990 | 3.2 | 2.2 | 5.4 | 9.2 | 4.7 | 9.7 | 8.3 | 7.0 | 5.7 | 8.3 | 6.8 | 10.5 | 4.1 | 6.4 | 8.4 | 6.9 | 6.0 | ||
| 1989 | 7.1 | 11.2 | 9.2 | 8.8 | 8.1 | 9.6 | 3.2 | 9.8 | 5.0 | 11.8 | 3.9 | 10.7 | 9.7 | 8.7 | 7.7 | 7.2 | 8.4 | ||
| 1988 | 6.5 | 9.3 | 9.0 | 10.2 | 3.8 | 10.3 | 5.0 | 9.1 | 6.9 | 13.9 | 6.6 | 8.7 | 8.2 | 7.3 | 8.1 | 9.0 | 8.1 | ||
| 1987 | 18.2 | 20.0 | 9.3 | 11.3 | 5.1 | 12.8 | 9.7 | 11.2 | 6.2 | 7.8 | 3.5 | 13.7 | 14.3 | 8.2 | 11.3 | 5.9 | 9.0 | ||
| 1986 | 0.0 | 15.8 | 5.7 | 16.7 | 2.1 | 17.6 | 0.0 | 25.0 | 3.2 | 13.7 | 6.9 | 17.1 | 12.1 | 7.4 | 16.1 | 9.0 | 10.7 | ||
| 1985 | 10.0 | 66.7 | 32.7 | 22.1 | 22.8 | 28.3 | 25.0 | 47.1 | 9.1 | 42.1 | 10.0 | 25.0 | 34.1 | 25.1 | 31.8 | 25.0 | 28.4 | ||
| 1984 | 0.0 | 70.0 | 0.0 | 41.7 | 0.0 | 50.0 | 6.9 | 66.7 | 3.7 | 61.8 | 6.5 | 50.0 | 49.0 | 23.8 | 40.5 | 26.1 | 35.2 | ||
| 1983 | 0.0 | 58.3 | 20.0 | 61.5 | 44.4 | 61.5 | 0.0 | 63.6 | 0.0 | - | 41.7 | 54.5 | 44.8 | 48.1 | 50.0 | 35.7 | 46.0 | ||
| 1982 | - | 63.6 | - | 0.0 | 87.5 | 42.9 | - | 54.5 | - | 53.8 | - | 57.1 | 60.0 | 77.8 | 48.0 | 53.8 | 56.9 | ||
Breeding data
Breeding records by month
Number of breeding records by breeding code and month, 2017 and all years| Breeding code | Jul | Aug | Sep | Oct | Nov | Dec | Jan | Feb | Mar | Apr | May | Jun |
|---|---|---|---|---|---|---|---|---|---|---|---|---|
| 2017 | ||||||||||||
| Breeding (BLA code) | 0 | 0 | 0 | 0 | 0 | 0 | 0 | 0 | 0 | 0 | 0 | 0 |
| Carrying Food | 0 | 0 | 0 | 0 | 0 | 1 | 0 | 0 | 0 | 0 | 0 | 0 |
| Copulating | 0 | 0 | 0 | 0 | 0 | 0 | 0 | 0 | 0 | 0 | 0 | 0 |
| Display | 0 | 3 | 4 | 1 | 0 | 0 | 0 | 1 | 0 | 0 | 1 | 1 |
| Dependent young | 0 | 0 | 5 | 18 | 33 | 22 | 32 | 21 | 6 | 3 | 0 | 1 |
| Faecal sac | 0 | 0 | 0 | 0 | 0 | 0 | 0 | 0 | 0 | 0 | 0 | 0 |
| Inspecting hollow | 0 | 0 | 0 | 0 | 0 | 0 | 0 | 0 | 0 | 0 | 0 | 0 |
| Nest building | 0 | 1 | 0 | 0 | 0 | 0 | 0 | 0 | 1 | 0 | 0 | 0 |
| Nest with eggs | 0 | 0 | 0 | 0 | 0 | 0 | 0 | 0 | 0 | 0 | 0 | 0 |
| Nest with young | 0 | 1 | 0 | 1 | 0 | 0 | 0 | 0 | 0 | 0 | 0 | 0 |
| On/leaving nest | 0 | 0 | 1 | 1 | 0 | 0 | 0 | 0 | 0 | 0 | 0 | 0 |
| All years | ||||||||||||
| Breeding (BLA code) | 2 | 2 | 2 | 6 | 15 | 11 | 9 | 1 | 0 | 0 | 0 | 0 |
| Carrying Food | 0 | 0 | 0 | 0 | 2 | 1 | 0 | 0 | 0 | 0 | 0 | 0 |
| Copulating | 0 | 2 | 1 | 2 | 0 | 0 | 0 | 0 | 0 | 0 | 0 | 0 |
| Display | 3 | 6 | 8 | 3 | 0 | 1 | 3 | 3 | 1 | 0 | 1 | 3 |
| Dependent young | 1 | 2 | 10 | 101 | 109 | 81 | 92 | 53 | 18 | 9 | 5 | 5 |
| Faecal sac | 0 | 0 | 0 | 0 | 0 | 0 | 0 | 0 | 0 | 0 | 0 | 0 |
| Inspecting hollow | 0 | 0 | 0 | 0 | 0 | 0 | 0 | 0 | 0 | 0 | 0 | 0 |
| Nest building | 0 | 3 | 3 | 6 | 1 | 3 | 1 | 2 | 1 | 0 | 0 | 0 |
| Nest with eggs | 0 | 1 | 1 | 0 | 1 | 4 | 0 | 0 | 0 | 0 | 0 | 0 |
| Nest with young | 1 | 1 | 0 | 4 | 2 | 1 | 1 | 0 | 0 | 0 | 0 | 0 |
| On/leaving nest | 1 | 1 | 6 | 14 | 3 | 1 | 2 | 0 | 0 | 0 | 0 | 0 |
Breeding records by year
Average number of breeding records per period by breeding code| Period | Breeding (BLA code) | Carrying Food | Copulating | Display | Dependent young | Faecal sac | Inspecting hollow | Nest building | Nest with eggs | Nest with young | On/leaving nest |
|---|---|---|---|---|---|---|---|---|---|---|---|
| All years | |||||||||||
| All | 1.3 | 0.1 | 0.1 | 0.9 | 13.5 | 0.0 | 0.0 | 0.6 | 0.2 | 0.3 | 0.8 |
| Previous years | |||||||||||
| All previous years | 1.4 | 0.1 | 0.1 | 0.6 | 9.9 | 0.0 | 0.0 | 0.5 | 0.2 | 0.2 | 0.7 |
| Previous 30 years | 1.6 | 0.1 | 0.2 | 0.7 | 11.2 | 0.0 | 0.0 | 0.6 | 0.2 | 0.2 | 0.9 |
| Previous 20 years | 2.4 | 0.0 | 0.2 | 1.1 | 13.9 | 0.0 | 0.0 | 0.4 | 0.0 | 0.3 | 1.2 |
| 10 year groups | |||||||||||
| [2007,2017) | 4.1 | 0.0 | 0.3 | 2.1 | 20.4 | 0.0 | 0.0 | 0.6 | 0.0 | 0.6 | 2.1 |
| [1997,2007) | 0.6 | 0.0 | 0.2 | 0.0 | 7.5 | 0.0 | 0.0 | 0.2 | 0.0 | 0.1 | 0.3 |
| [1987,1997) | 0.1 | 0.2 | 0.0 | 0.0 | 5.7 | 0.0 | 0.0 | 1.0 | 0.6 | 0.0 | 0.2 |
| 5 year groups | |||||||||||
| [2012,2017) | 4.2 | 0.0 | 0.0 | 4.2 | 27.0 | 0.0 | 0.0 | 0.8 | 0.0 | 1.0 | 2.4 |
| [2007,2012) | 4.0 | 0.0 | 0.6 | 0.0 | 13.8 | 0.0 | 0.0 | 0.4 | 0.0 | 0.2 | 1.8 |
| [2002,2007) | 1.2 | 0.0 | 0.4 | 0.0 | 10.2 | 0.0 | 0.0 | 0.2 | 0.0 | 0.2 | 0.4 |
| [1997,2002) | 0.0 | 0.0 | 0.0 | 0.0 | 4.8 | 0.0 | 0.0 | 0.2 | 0.0 | 0.0 | 0.2 |
| [1992,1997) | 0.2 | 0.0 | 0.0 | 0.0 | 2.8 | 0.0 | 0.0 | 0.0 | 0.0 | 0.0 | 0.2 |
| [1987,1992) | 0.0 | 0.4 | 0.0 | 0.0 | 8.6 | 0.0 | 0.0 | 2.0 | 1.2 | 0.0 | 0.2 |
| Year | |||||||||||
| 2017 | 0.0 | 1.0 | 0.0 | 11.0 | 141.0 | 0.0 | 0.0 | 2.0 | 0.0 | 2.0 | 2.0 |
| 2016 | 0.0 | 0.0 | 0.0 | 9.0 | 46.0 | 0.0 | 0.0 | 1.0 | 0.0 | 1.0 | 2.0 |
| 2015 | 1.0 | 0.0 | 0.0 | 11.0 | 51.0 | 0.0 | 0.0 | 2.0 | 0.0 | 2.0 | 9.0 |
| 2014 | 1.0 | 0.0 | 0.0 | 1.0 | 18.0 | 0.0 | 0.0 | 1.0 | 0.0 | 2.0 | 0.0 |
| 2013 | 3.0 | 0.0 | 0.0 | 0.0 | 5.0 | 0.0 | 0.0 | 0.0 | 0.0 | 0.0 | 1.0 |
| 2012 | 16.0 | 0.0 | 0.0 | 0.0 | 15.0 | 0.0 | 0.0 | 0.0 | 0.0 | 0.0 | 0.0 |
| 2011 | 1.0 | 0.0 | 0.0 | 0.0 | 10.0 | 0.0 | 0.0 | 0.0 | 0.0 | 1.0 | 3.0 |
| 2010 | 2.0 | 0.0 | 0.0 | 0.0 | 20.0 | 0.0 | 0.0 | 0.0 | 0.0 | 0.0 | 3.0 |
| 2009 | 9.0 | 0.0 | 1.0 | 0.0 | 15.0 | 0.0 | 0.0 | 1.0 | 0.0 | 0.0 | 2.0 |
| 2008 | 2.0 | 0.0 | 2.0 | 0.0 | 18.0 | 0.0 | 0.0 | 1.0 | 0.0 | 0.0 | 0.0 |
| 2007 | 6.0 | 0.0 | 0.0 | 0.0 | 6.0 | 0.0 | 0.0 | 0.0 | 0.0 | 0.0 | 1.0 |
| 2006 | 3.0 | 0.0 | 0.0 | 0.0 | 10.0 | 0.0 | 0.0 | 0.0 | 0.0 | 1.0 | 1.0 |
| 2005 | 2.0 | 0.0 | 0.0 | 0.0 | 12.0 | 0.0 | 0.0 | 0.0 | 0.0 | 0.0 | 0.0 |
| 2004 | 1.0 | 0.0 | 1.0 | 0.0 | 9.0 | 0.0 | 0.0 | 0.0 | 0.0 | 0.0 | 0.0 |
| 2003 | 0.0 | 0.0 | 0.0 | 0.0 | 9.0 | 0.0 | 0.0 | 0.0 | 0.0 | 0.0 | 1.0 |
| 2002 | 0.0 | 0.0 | 1.0 | 0.0 | 11.0 | 0.0 | 0.0 | 1.0 | 0.0 | 0.0 | 0.0 |
| 2001 | 0.0 | 0.0 | 0.0 | 0.0 | 2.0 | 0.0 | 0.0 | 0.0 | 0.0 | 0.0 | 0.0 |
| 2000 | 0.0 | 0.0 | 0.0 | 0.0 | 4.0 | 0.0 | 0.0 | 1.0 | 0.0 | 0.0 | 0.0 |
| 1999 | 0.0 | 0.0 | 0.0 | 0.0 | 15.0 | 0.0 | 0.0 | 0.0 | 0.0 | 0.0 | 0.0 |
| 1998 | 0.0 | 0.0 | 0.0 | 0.0 | 2.0 | 0.0 | 0.0 | 0.0 | 0.0 | 0.0 | 1.0 |
| 1997 | 0.0 | 0.0 | 0.0 | 0.0 | 1.0 | 0.0 | 0.0 | 0.0 | 0.0 | 0.0 | 0.0 |
| 1996 | 0.0 | 0.0 | 0.0 | 0.0 | 3.0 | 0.0 | 0.0 | 0.0 | 0.0 | 0.0 | 0.0 |
| 1995 | 1.0 | 0.0 | 0.0 | 0.0 | 0.0 | 0.0 | 0.0 | 0.0 | 0.0 | 0.0 | 1.0 |
| 1994 | 0.0 | 0.0 | 0.0 | 0.0 | 7.0 | 0.0 | 0.0 | 0.0 | 0.0 | 0.0 | 0.0 |
| 1993 | 0.0 | 0.0 | 0.0 | 0.0 | 1.0 | 0.0 | 0.0 | 0.0 | 0.0 | 0.0 | 0.0 |
| 1992 | 0.0 | 0.0 | 0.0 | 0.0 | 3.0 | 0.0 | 0.0 | 0.0 | 0.0 | 0.0 | 0.0 |
| 1991 | 0.0 | 0.0 | 0.0 | 0.0 | 0.0 | 0.0 | 0.0 | 0.0 | 0.0 | 0.0 | 0.0 |
| 1990 | 0.0 | 0.0 | 0.0 | 0.0 | 5.0 | 0.0 | 0.0 | 0.0 | 1.0 | 0.0 | 0.0 |
| 1989 | 0.0 | 1.0 | 0.0 | 0.0 | 15.0 | 0.0 | 0.0 | 1.0 | 5.0 | 0.0 | 1.0 |
| 1988 | 0.0 | 1.0 | 0.0 | 0.0 | 11.0 | 0.0 | 0.0 | 3.0 | 0.0 | 0.0 | 0.0 |
| 1987 | 0.0 | 0.0 | 0.0 | 0.0 | 12.0 | 0.0 | 0.0 | 6.0 | 0.0 | 0.0 | 0.0 |
| 1986 | 0.0 | 0.0 | 0.0 | 0.0 | 1.0 | 0.0 | 0.0 | 0.0 | 0.0 | 0.0 | 0.0 |
| 1985 | 0.0 | 0.0 | 0.0 | 0.0 | 5.0 | 0.0 | 0.0 | 0.0 | 1.0 | 0.0 | 0.0 |
| 1984 | 0.0 | 0.0 | 0.0 | 0.0 | 0.0 | 0.0 | 0.0 | 0.0 | 0.0 | 0.0 | 0.0 |
| 1983 | 0.0 | 0.0 | 0.0 | 0.0 | 1.0 | 0.0 | 0.0 | 0.0 | 0.0 | 1.0 | 0.0 |
| 1982 | 0.0 | 0.0 | 0.0 | 0.0 | 2.0 | 0.0 | 0.0 | 0.0 | 0.0 | 0.0 | 0.0 |
Distribution map
Distribution - 2017
This map shows the observed distribution of the Purple Swamphen for 2017.
The red circles are the grid cells where Purple Swamphen have been reported.
The transparency of the red circles indicate how many surveys sheets were submitted for that grid cell; the darker the red the more reliable the data. Of the 315 grid cells with reports, 83 had only one sheet; an example is grid number D26.
The size of the circle represents the reporting rate. The maximum reporting rate for Purple Swamphen was 100.0% (eg grid number D26) and the minimum was 0.3% (eg grid number J13). 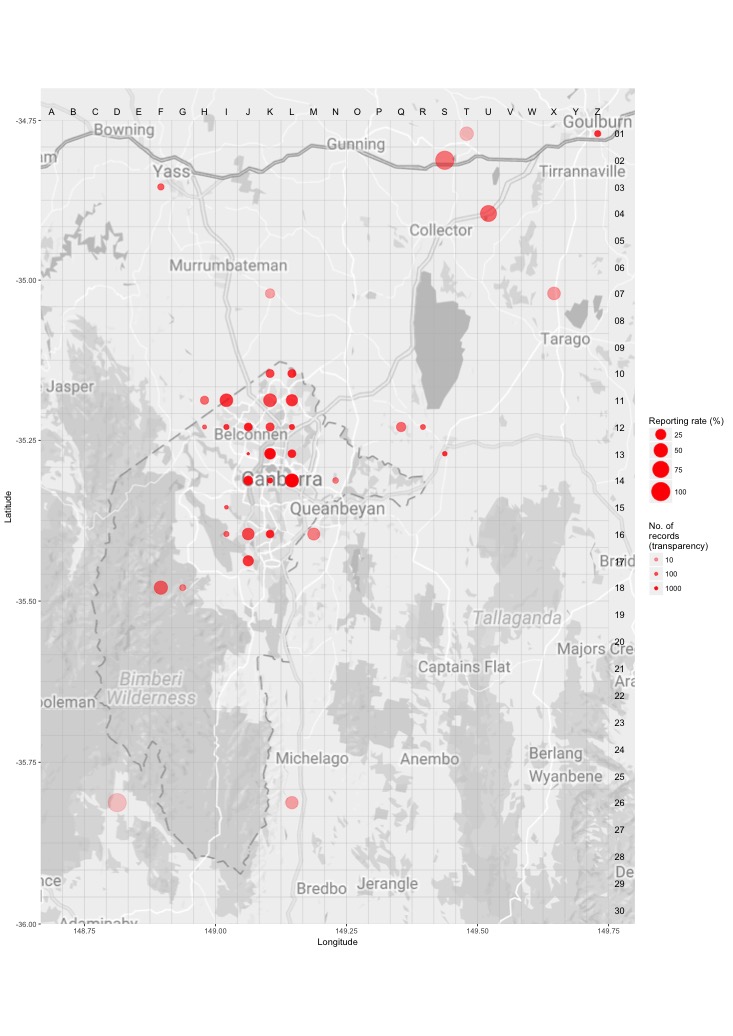
Distribution - all years
This map shows the observed distribution of the Purple Swamphen for all years.
The red circles are the grid cells where Purple Swamphen have been reported.
The transparency of the red circles indicate how many surveys sheets were submitted for that grid cell; the darker the red the more reliable the data. Of the 703 grid cells with reports, 55 had only one sheet; an example is grid number A12.
The size of the circle represents the reporting rate. The maximum reporting rate for Purple Swamphen was 84.5% (eg grid number S2) and the minimum was 0.0% (eg grid number K15). 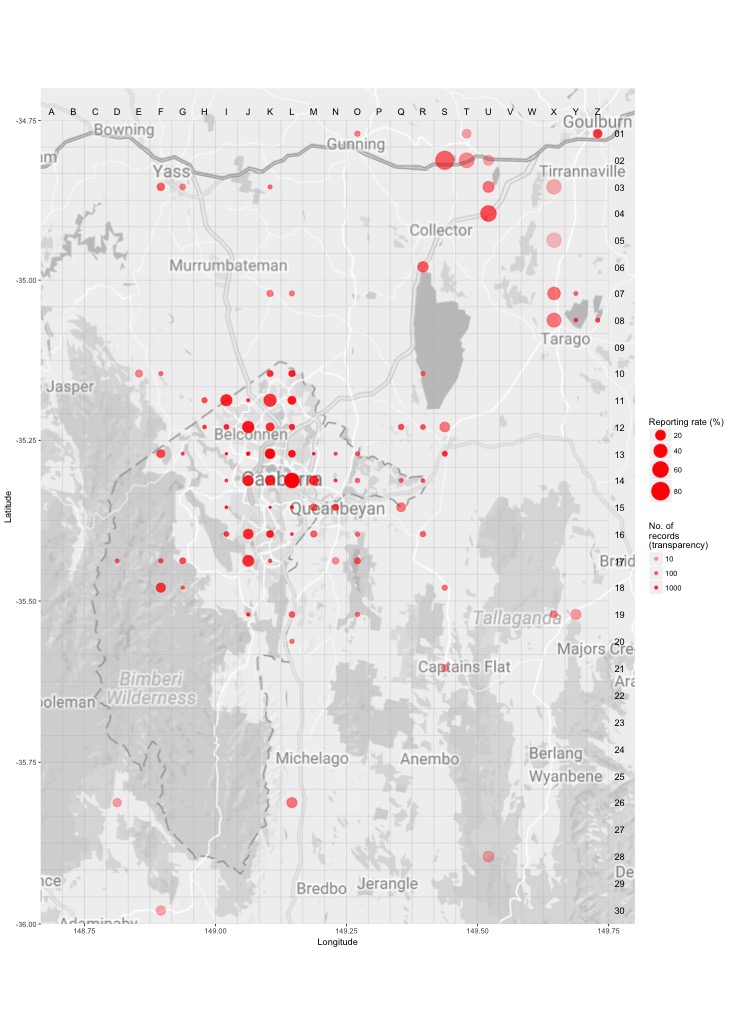
Breeding map
Breeding - 2017
This map shows the breeding distribution of the Purple Swamphen for 2017.
The red circles are the grid cells where breeding activity for Purple Swamphen have been reported.
The size of the circle represents the number of reports. 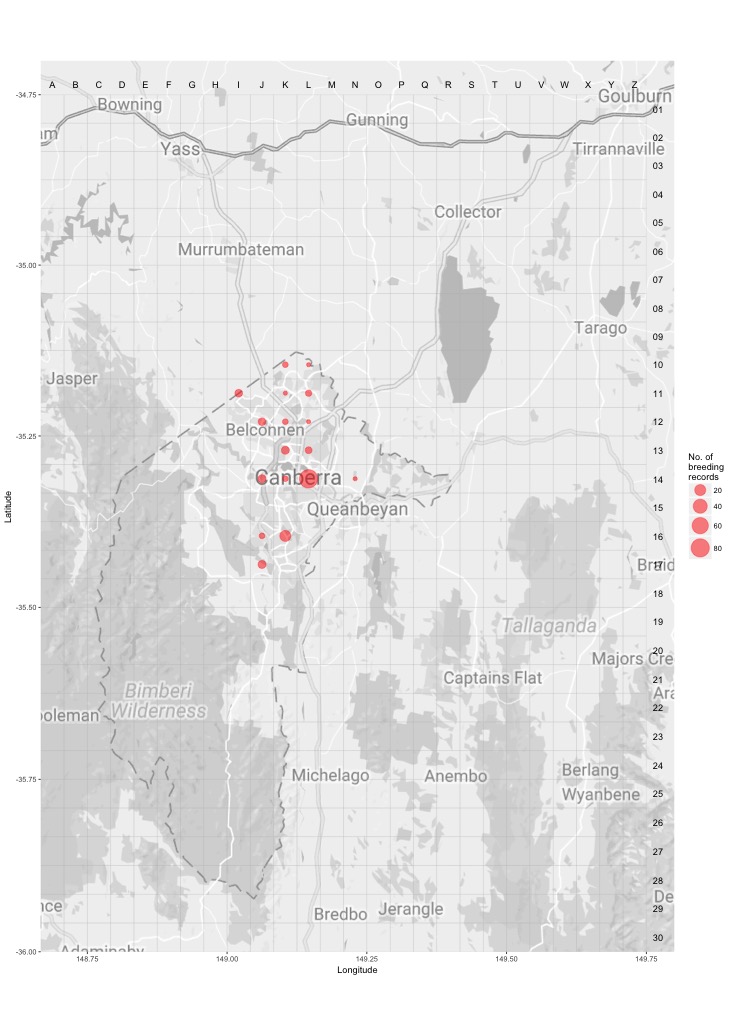
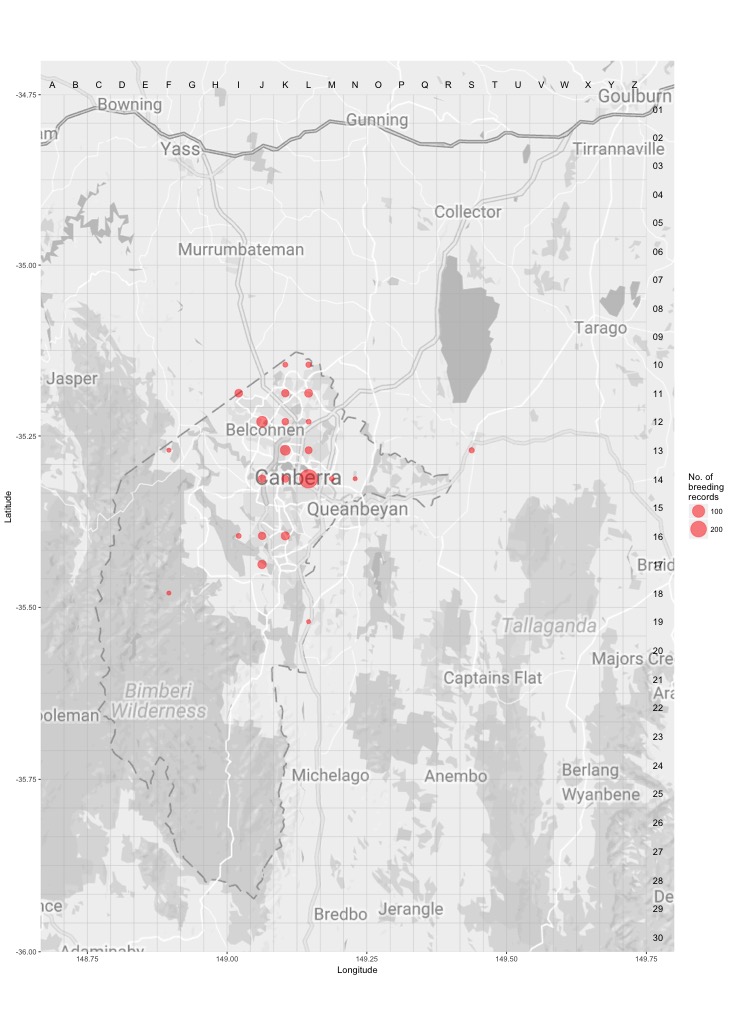
Breeding - all years
This map shows the breeding distribution of the Purple Swamphen for all years.
The red circles are the grid cells where breeding activity for Purple Swamphen have been reported.
The size of the circle represents the number of reports.